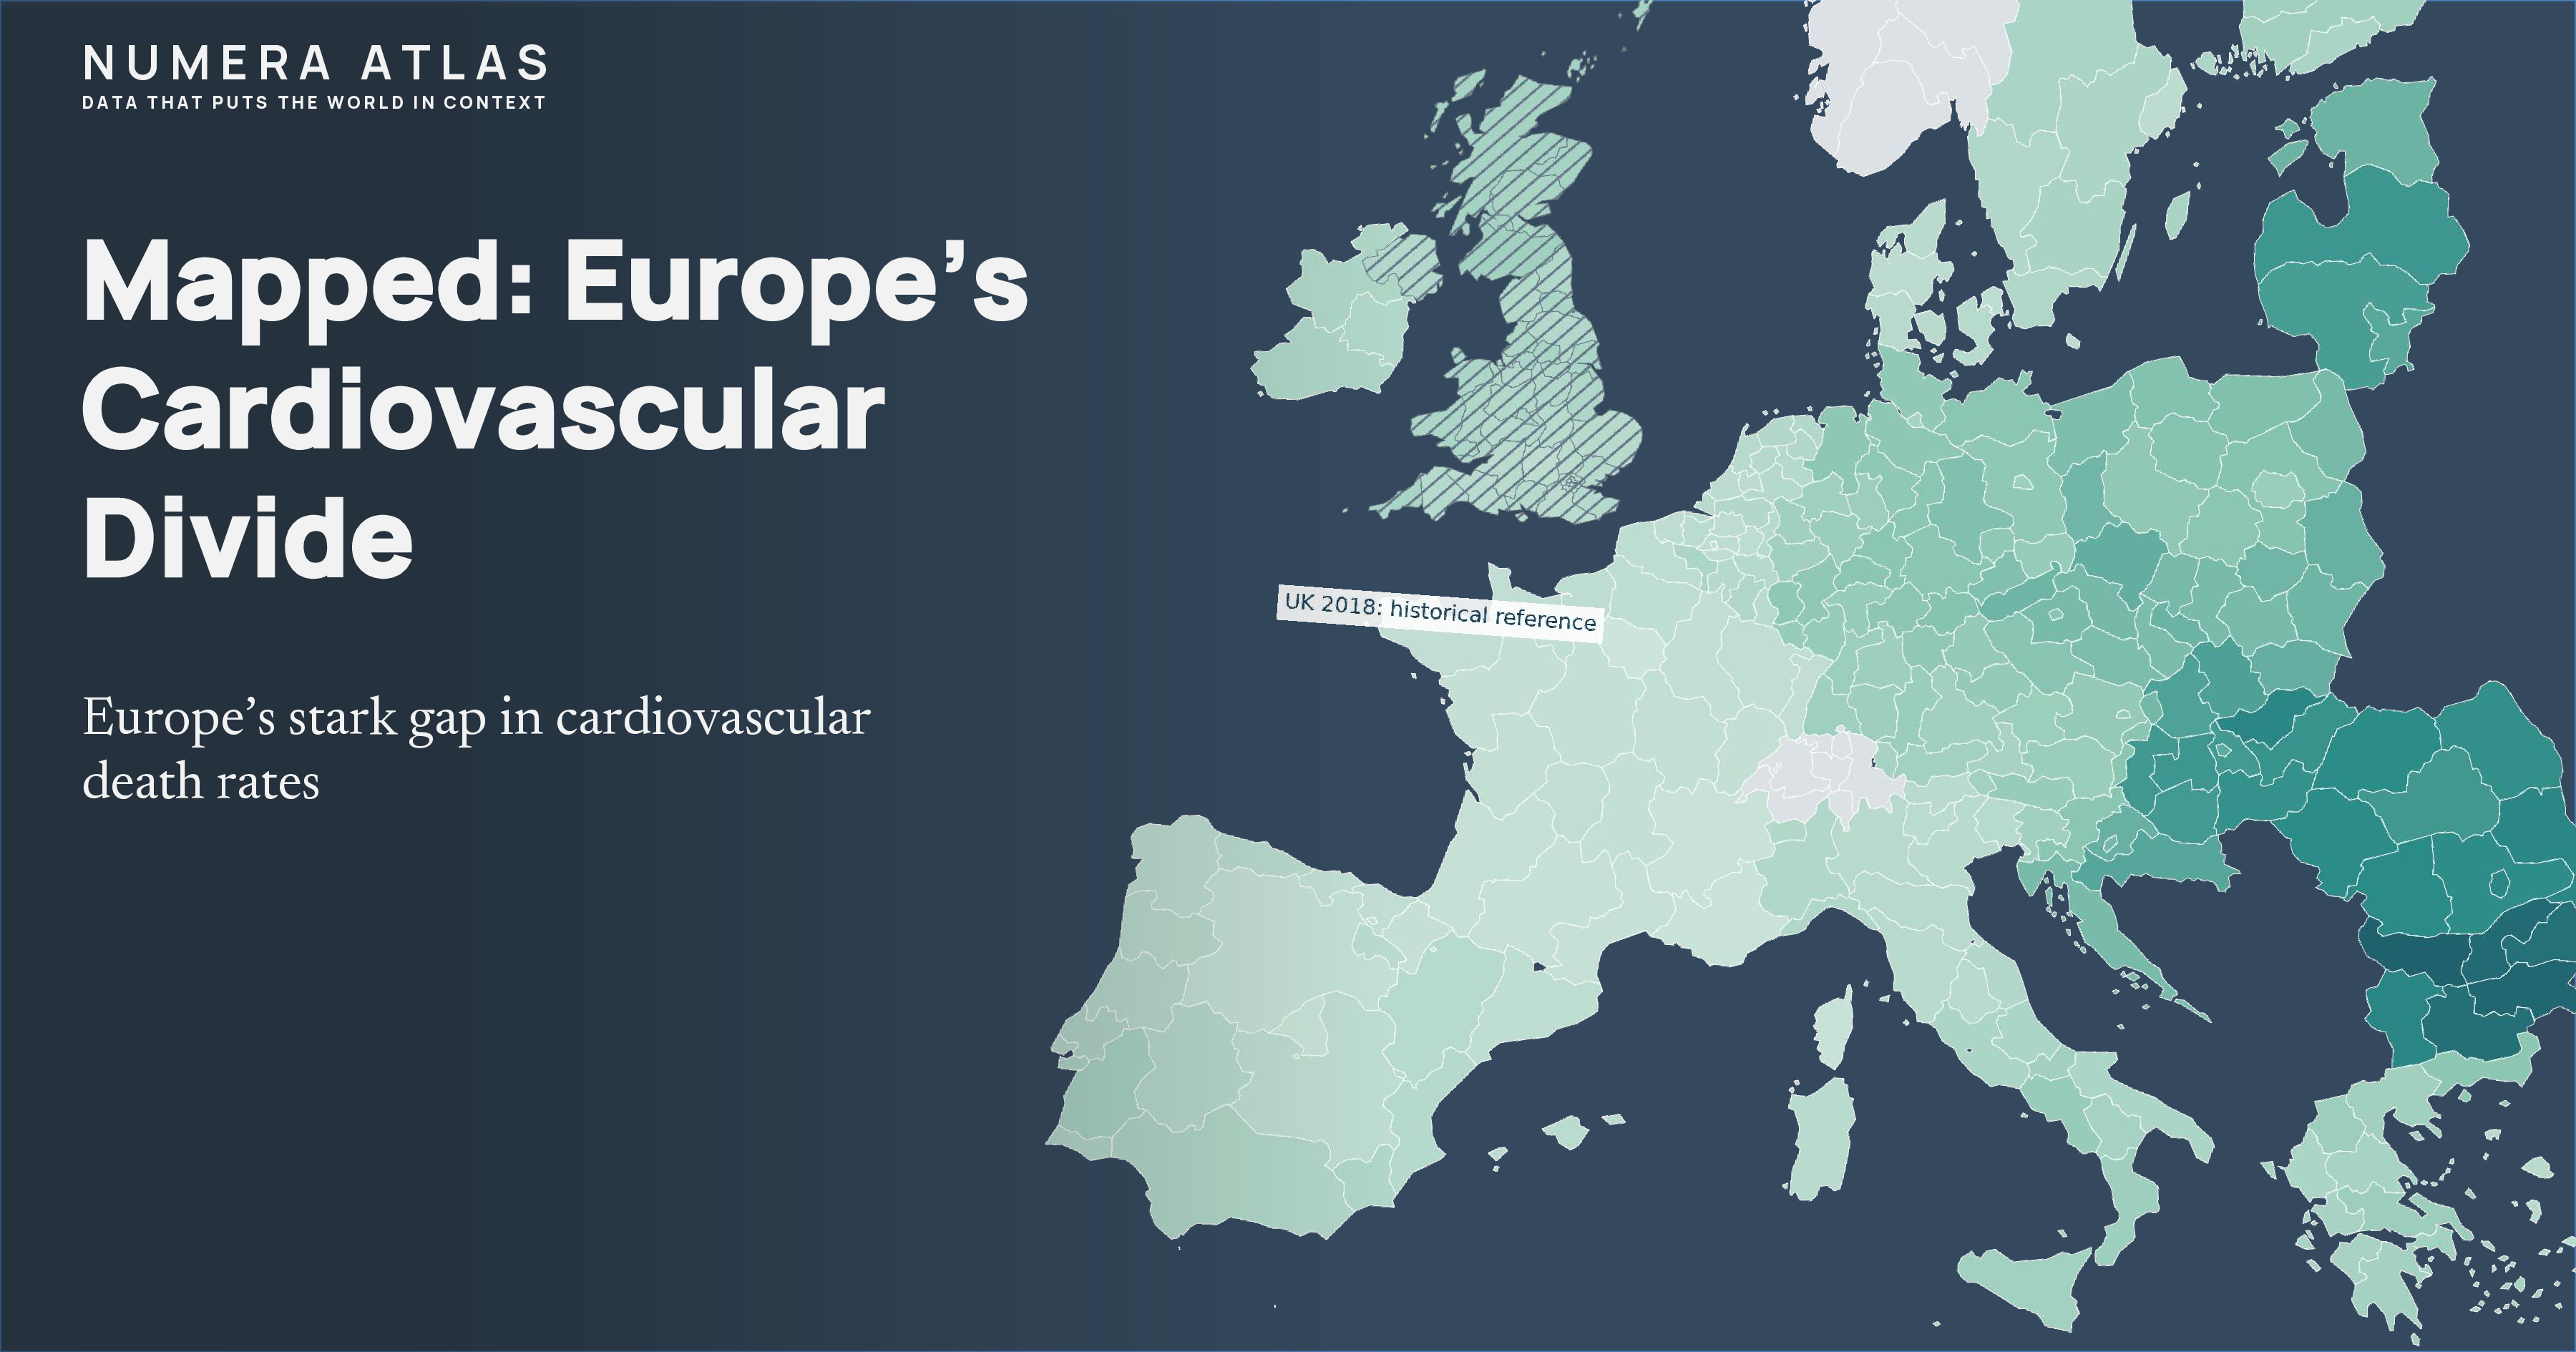
Circulatory diseases caused almost one in three EU deaths in 2023. Regional mortality rates reveal a stark divide even after accounting for population age, with the highest rate almost eight times the lowest.

The big picture
Around 1.6 million people died from diseases of the circulatory system in the EU in 2023, representing 32.5% of all deaths. Eurostat’s September 2026 release highlights how unevenly that burden is distributed. The category includes ischaemic heart disease, hypertensive diseases and cerebrovascular diseases, including strokes.
Our map compares age-standardised mortality across 244 EU regions. This accounts for differences in population age, helping distinguish geographical differences in mortality from the simple fact that some regions have more older residents.
A gap that survives age adjustment
In our Eurostat data extract, Severozapaden in north-west Bulgaria recorded 1,014.9 deaths per 100,000 inhabitants in 2023. Île-de-France recorded 132.1—a roughly 7.7-fold difference.
The five highest regional rates in the extract are all in Bulgaria. Several French regions appear near the other end of the distribution, alongside Madrid.
| Region | Country | Deaths per 100,000* |
|---|---|---|
| Severozapaden | Bulgaria | 1,014.9 |
| Yugoiztochen | Bulgaria | 987.4 |
| Severen tsentralen | Bulgaria | 963.9 |
| Île-de-France | France | 132.1 |
| Provence-Alpes-Côte d’Azur | France | 142.7 |
| Rhône-Alpes | France | 146.0 |
Selected regions; age-standardised rates, 2023. Source: packaged Eurostat extract.
These are rates adjusted to a common population age structure. They are not the actual number of deaths in every group of 100,000 residents, nor an individual’s predicted risk.
Why the measure matters
The percentage of deaths attributed to circulatory disease answers a different question: how large is this cause relative to everything else people die from?
That percentage can change because deaths from other causes change. Age-standardised deaths per 100,000 provide a more useful basis for this map’s geographical comparison.
The EU reference rate was approximately 313 per 100,000. Eurostat reported 108 regions at or above that benchmark and 136 below it.
What might lie behind the divide?
Cardiovascular mortality reflects exposure to risk factors as well as prevention, diagnosis and treatment. WHO identifies tobacco, unhealthy diet, physical inactivity, harmful alcohol use and air pollution among relevant risks. High blood pressure, raised blood glucose and blood lipids, and excess weight can also signal increased risk.
The regional mortality dataset does not isolate the contribution of each factor. It cannot establish that a particular diet, income level or healthcare system caused a region’s position. Differences in death certification and coding also warrant care when interpreting comparisons.
Age adjustment makes the map more informative, but it does not explain the entire gap. The pattern provides a starting point for investigating where prevention and care face the greatest challenges.
Where does the UK fit?
The UK observations in this package are historical: 2018, compared with 2023 for the main EU map.
The UK national rate was 236.9 per 100,000 in 2018. Across its 41 mapped regions, values ranged from 182.5 in Inner London–West to 302.5 in Southern Scotland.
Those figures add context; they do not establish the UK’s current position against the EU. UK regions are therefore hatched and labelled with their year, and excluded from current EU rankings. The package includes a separate 2018 country comparison for a map using the same reference year.
What the map tells us
Europe’s circulatory mortality divide remains substantial after differences in population age are taken into account. The next question is which combinations of risk exposure, prevention and treatment help explain that geography—and how those patterns change over time.
Methodology: Eurostat hlth_cd_asdr2, ICD-10 chapter I, both sexes, all ages. Age-standardised deaths per 100,000 inhabitants. Data downloaded 6 October 2026; EU observations 2023, UK observations 2018.